Dashboard
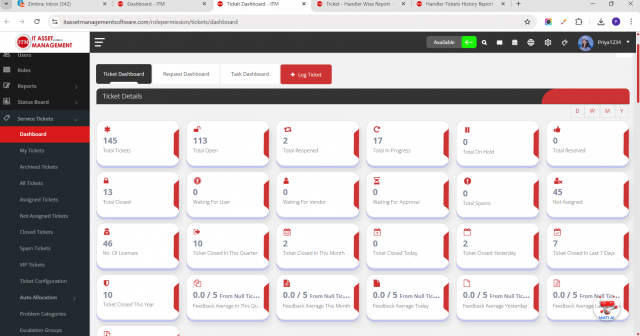
To view the dashboard
Go to the left sidebar and select Service Tickets > Click on Dashboard.

In the dashboard, Top Performer is determined based on the feedback given by the end user for the resolved tickets.
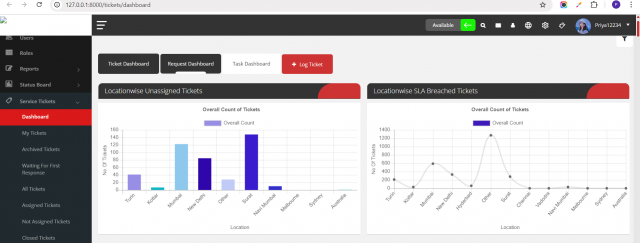
Click on the Request Dashboard Tab.
you can view the all ticket related graph such as Locationwise Unassigned Tickets,Locationwise SLA Breached Tickets etc.. 
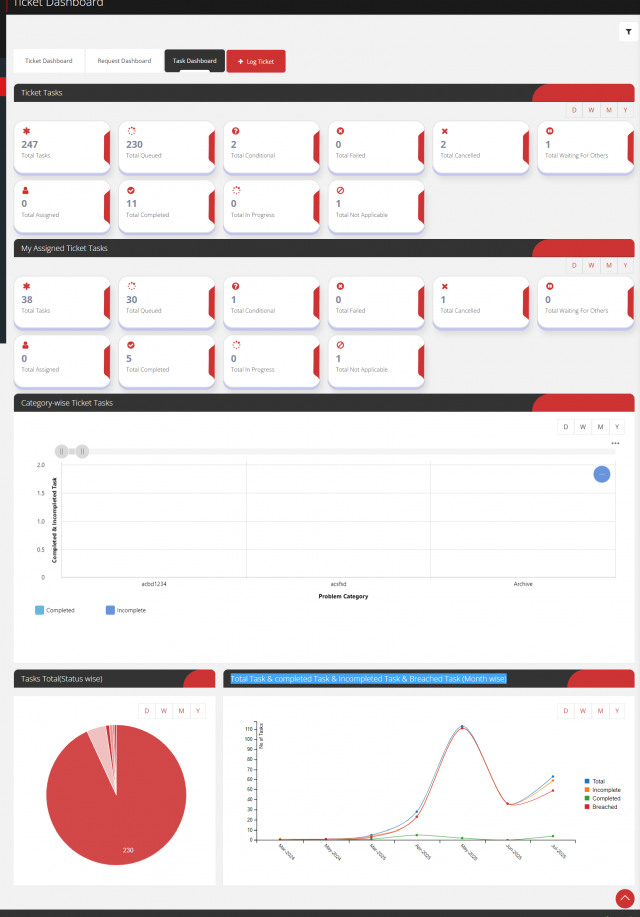
Click on the Task Dashboard Tab.
you can view the count of task and display graph of related task such as Category-wise Ticket Tasks,Tasks Total(Status wise),Total Task & completed Task & Incompleted Task & Breached Task (Month wise) etc..

We are continuously improving our documentation to ensure it meets your needs. This document will be updated regularly, so please check back for the latest information. If you have any questions or encounter any issues, feel free to reach out to us at support@itassetmanagement.in.